1. Short Description
The Cyber-Attack Detection Framework (CADF) is a security solution meant to help users recognize potential threats and attacks.
It has been developed as an enhanced SIEM solution, as it is able to collect security events from end-node sensors, correlate events coming from heterogeneous sources, provide analytics on the status of the system and raise alerts in case of dangerous scenarios.
The user can view all the necessary information on an intuitive GUI, which can be customized according to the use case requirements.
2. Main Purpose and Benefits
The CADF aims to improve the
security of production and business systems in the space sector alongside the
pre-existing security systems, by detecting targeted threats and
vulnerabilities.
The Cyber-Attack Detection
Framework has been created to provide a highly targeted system for monitoring
the security of ground segment systems, applications, and services. It creates
an “overlay” architecture of add-on components that enhances the security of
data in a transparent fashion. The solution provides a set of non-invasive
security tools organized in an architecture, which are easily pluggable inside
existing systems of the organizations and can be also adopted in subsets to
protect confidential data from attacks occurring on different areas of these
systems.
This solution is able to correlate,
analyse and report information from a variety of data sources such as network
devices, identity management devices, access management devices and operating
systems. The result is a holistic view of the system’s security.
The CADF presents unique features,
such as the privacy preserving computation feature, which is the ability to
protect the privacy of managed data during its computation. This is of main
importance to protect data confidentiality against high privileged attackers.
The CADF is also a scalable and elastic framework thanks to a modular, loosely
coupled architecture and the adoption of a best of breed selection of currently
available technologies.
3. Main Functions
The CADF
is a software application deployed in Docker containers. The overall
architecture is shown in Figure 3-1.
The
systems are initially monitored through the Cyber-Attack Detection Layer: it
consists of a set of cyber-related probes installed on sensitive end-nodes and
provides a first level of threat detection.
The data
is then collected, classified, further processed and possibly correlated
between the different sources identified through the Cyber-Attack Correlation
Solution.
All the
information collected is finally displayed on dedicated dashboards by system /
security administrators, in order to perform the attack pattern recognition and
threat mitigation.
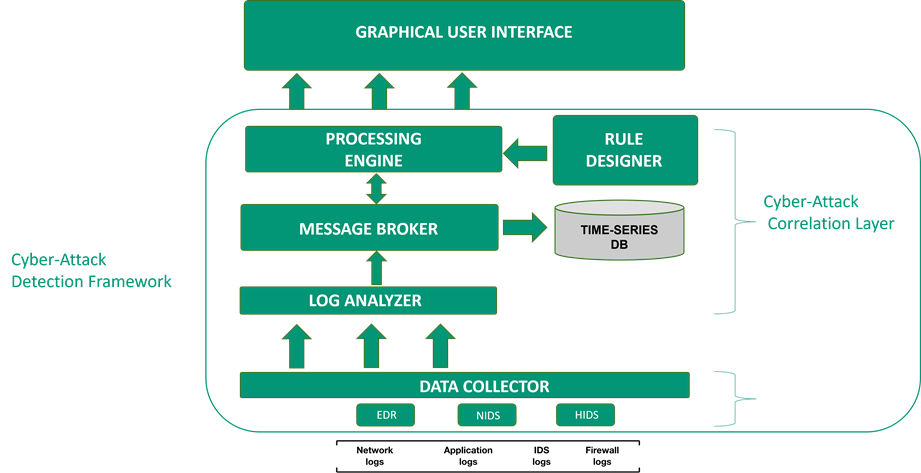
Figure 3‑1 – CADF Architecture
The following components have been
implemented in the Detection Layer:
- Network Intrusion Detection
System
- Host-Based Intrusion Detection
System and File Integrity Monitor
- Endpoint Detection and Response
- Network Traffic Monitor
- ·Malware Scanner
- System-Level Monitor
- Data Collector
The Correlation Layer includes:
- Log Analysis Platform
- Message Broker
- Time-series Database
- Correlation Engine
- Rule Designer
Automated
functions include:
- Events gathering and forwarding
- Events correlation for alerts
generation
- Alerts conversion in Unified
Alert Format
- Messages storage in a
Time-Series Database
3.2. Manual Functions
Manual Functions, performed by the
user, include:
- Correlation rules design
- Security reports exportation
- Privacy-preserving Correlation
(on demand)
The
framework architecture is highly scalable and is composed of three main
modules: The Cyber-Attack Detection Layer, the Cyber-Attack Correlation
Solution and the Graphical User Interface, consisting of a set of custom
dashboards.
The module
communicates through the 7SHIELD Message Broker (optional) and it interact
closely with 7SHIELD Cyber-Physical Correlator (mandatory).
In order to guarantee a flexible
communication between all 7SHIELD components, all the system events and logs
within the CADF are converted to the IDMEF format and saved in the CADF Message
Broker, then forwarded to the 7SHIELD Message Broker at the same time.
5. Infrastructure RequirementsThe
Cyber-Attack Detection Layer must be installed on the system to monitor, since
it provides the security probes which are employed to detect suspicious events.
The Cyber-Attack Correlation Solution can be installed separately, on a
monitoring machine.
The CADF
requires Docker and Docker-Compose.
6. Operational Manual
The tool doesn’t require
installation. All the components have been deployed through Docker: by
configuring the detection layer and correlation layer docker-compose files, it
is possible to set and deploy the entire CADF.
6.2 Getting Started
The first step consists in
configuring the framework according to the user needs. In this step it is also possible
to select the security probes of interest, as well as configuring the Message
Broker, the services and applications to monitor, and so on.
Then, the Cyber-Attack Correlation
Solution and the Cyber-Attack Detection Layer can be started through
Docker-Compose. At this point, the
framework is already monitoring the system.
Once the framework is up, it is
also possible to add new correlation rules through the Rule Designer.
6.3 Nominal Operations
6.3.1 Notifications
Detailed alerts related to
suspicious events are displayed on the GUI and the Message Broker. For each
data source, a topic (a concept similar to folders) is created within the Message
Broker. Every time a message is stored in a topic, it is assigned a time-stamp.
The user can read all real-time or stored messages from different topics.
Once the configuration is
completed, data is automatically collected by the framework.
6.3.3 User Inputs
The user will be in charge of the configuration,
along with the creation of new correlation rules. The alerts can also be
configured and customized through the Rule Designer and the configuration
files.
6.3.4 User Output
It is also possible to render
(compile) the rules created through the dedicated tool in XML format, as well
importing the previously created rules.
Once the CADF has been launched,
the user can interact with the tool through the Rule Designer.
The Rule Designer is a web
application which enables the creation of new correlation rules through a
simple and intuitive graphical interface. Data sources, operators, and outputs
are represented by blocks, also called nodes, in the workspace. By linking the
blocks together, the user can create a workflow, defining the operations to be
performed on the input data. Each node has specific settings accessible via a
side menu that can be activated by clicking on the block, as shown in Figure 7-1.
The creation of a rule begins with the definition of a data source, which is
usually chosen among the available sources in the CADF message broker (Figure
7-2).
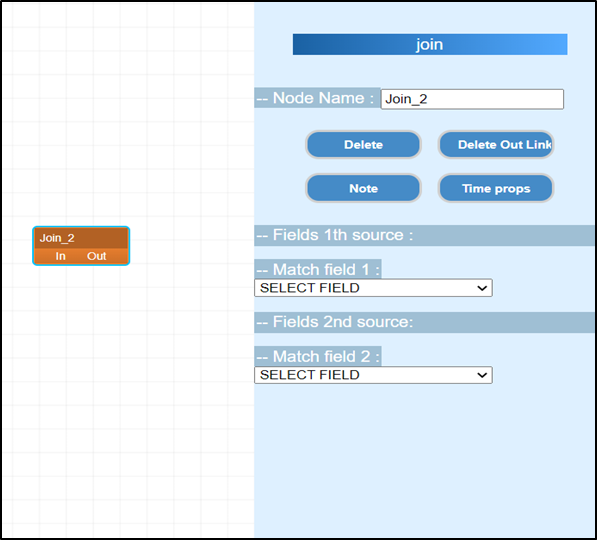
Figure 7‑1 - Rule Designer - Block
configuration
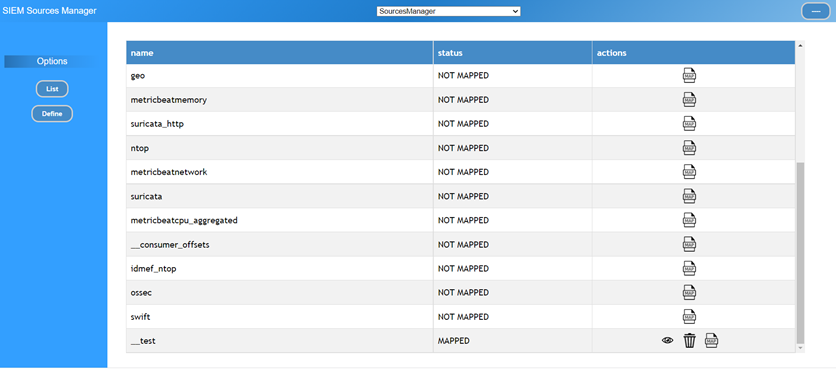
Figure 7‑2 - Rule Designer - Sources
managerTo design the rules, different building blocks can be used, using
all the powerful operations offered by the correlation engine. The building
phase of the rule requires an input block, a set of processing blocks and an
output block. It is possible to perform different operations in the processing
blocks, such as: aggregate in the same flow different incoming messages in a
defined time window, join different message flows together, filter some events
after some parameters exceed a threshold, use the threat intelligence operator
to enrich the events and so on. Finally, the result of the correlation is sent
to an output topic. An example is shown in Figure 7-3.
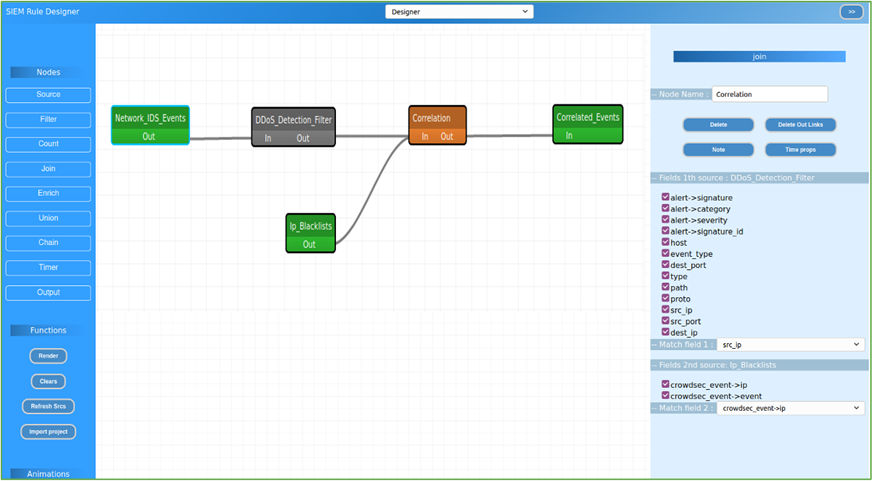
Figure 7‑3 - Rule Designer - Rule
creation
Once the rule has been designed, it can be exported (Fig 7-4) and
deployed on Apache Flink.
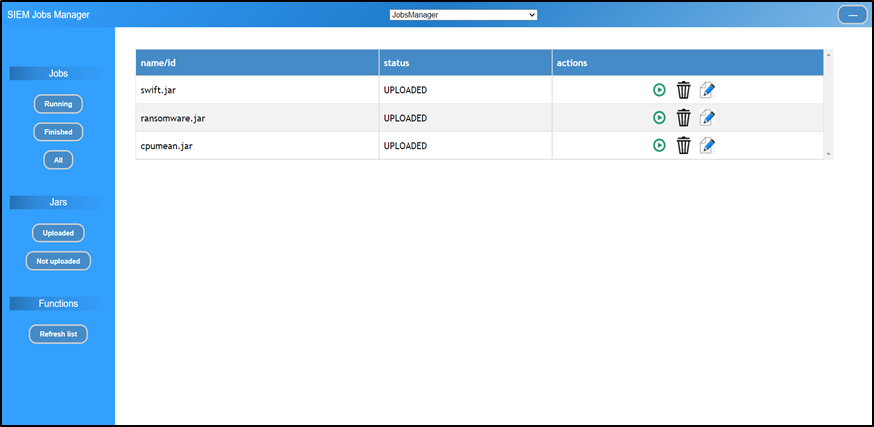
Figure 7‑4 - Rule Designer - Rule
management
Through dedicated Grafana
dashboards, the user can visualize the alerts and the metrics of the systems,
in order to get a real-time overview of its security state.
Th Main Dashboard displays a list
of all the available dashboards that have been implemented so far, along with
the status of the alerts, and a world map to identify the location of the
attacks, when required (Figure 7-5). In Figure 7-6, an example of custom
dashboard is displayed.
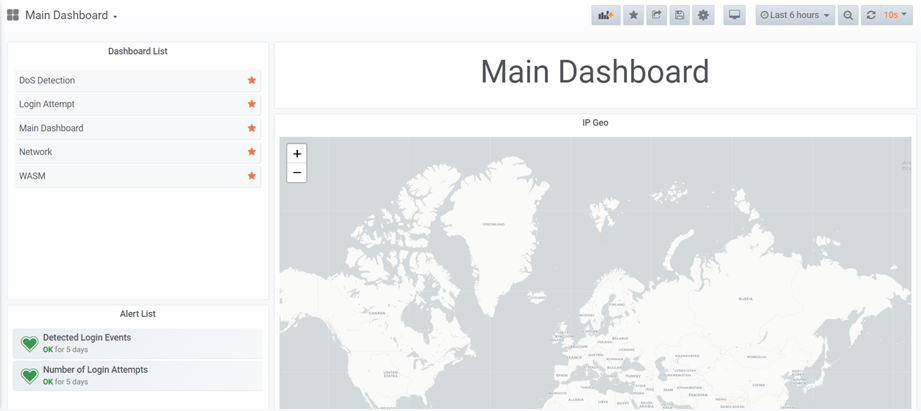
Figure 7‑5 - The GUI Main Dashboard
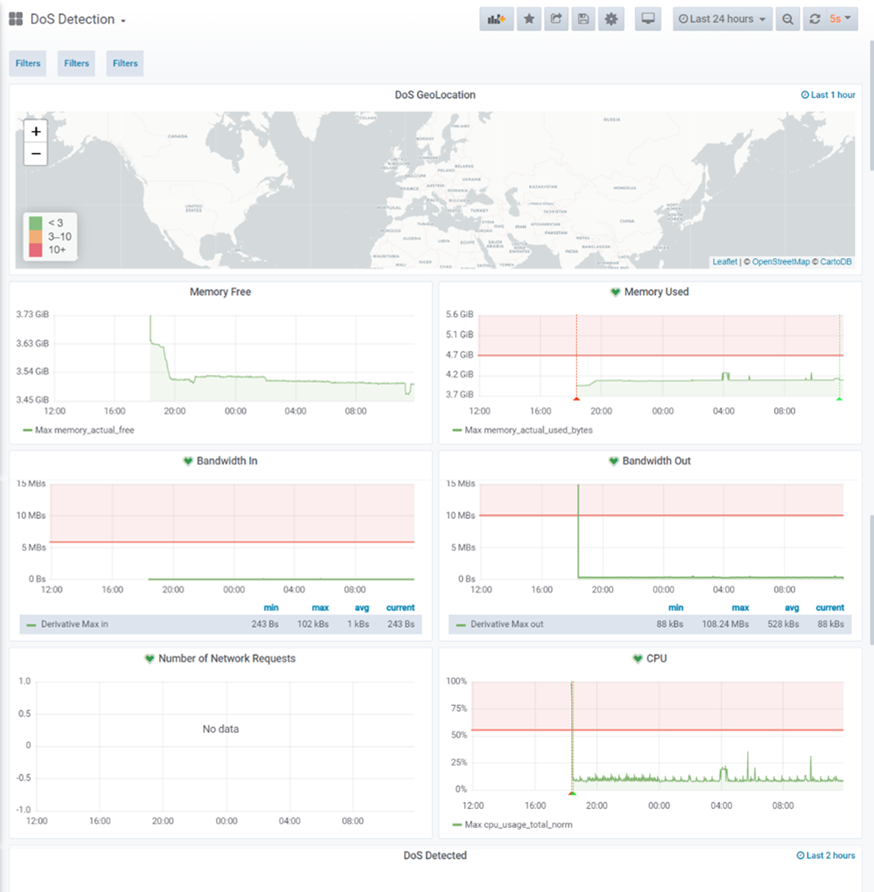
Figure 7‑6 - Example of custom Dashboard