1. Short Description
The Tactical Decision Support
System (TDSS) provides a system for First Responders (FRs) and Command and
Control (C2) structure, to enhance field operations and mission coordination.
The system has a field deployable
component, the First Responders Support System (FRSS), consisting of wearable
equipment, which includes several sensors to acquire environmental, biometric
and geolocation data embedded in a tactical vest to be worn by the FRs when
they perform their field missions. Also, when available, on the C2 side, it has
a Base Station, that establishes the wireless data bridge between the FRs
wearables and C2 components.
Although it can perform in a fully
stand-alone mode, to completely explore the FRSS capabilities, it must be
integrated with a C2 system. Thus, allowing not only to share data acquired
during field operations, but also to receive vital data concerning the mission
and targets evolution.
2. Main Purpose and Benefits
The Tactical Decision Support
System (TDSS) aims at improving each FR team member performance, by gathering
data from each team member and its surrounding environment. This data is relayed in real-time to a C2,
granting it a better view of the ever-evolving operational scenario, enabling
the C2 to make “last minute” adaptions to the ongoing mission and communicate
in real-time these changes to the team performing the mission.
Among others, following is a list
of easily identifiable benefits of using this solution:
From the C2 point-of-view
- Makes possible to follow in real-time
the rollout of the FRs mission;
- Enables a real-time view of each team
member geo-position on the field;
- Visualise all data collected, which
include vital signs (e.g., hearth rate, body temperature);
- Enables the definition of the mission
plan & sequence of steps;
- Enables the C2 to pinpoint the targets
to be presented to the team on the field;
- Enables the creation of mission logs
to further post-mission analysis;
- Enforces pre-established procedures
and rules for the execution of missions;
- Improves communication with the team
performing the mission;
- Improves coordination.
From FRs/FR team leader point-of-view
- Facilitates the monitoring of each
team member’s vitals status;
- Mission data, objectives, and targets
available to team leader in real-time;
- Real-time communications with C2;
- Enhanced communications between team
members on the field;
- Access to graphical mission map
enhanced with real-time mission related data;
- Access to known threats information,
enhances team safety;
- Improved team
performance/effectiveness;
- Faster team response;
- Easier control of mission variables.
3. Main Functions
The main
functions of the TDSS, perceived by its operators are mostly related to the
sensors, computational platform and the Graphical User Interface (GUI) made
available by the Universal Tactical Display (UTD).
3.1 Wearable Sensors
The TDSS gathers data from the
surrounding environment and its users, using several sensors. In its current
version, the TDSS uses the following list of sensors:
- Heart rate;
- Body temperature;
- Air temperature;
- CO2 concentration;
- Location (Global Positioning System – GPS).
It is important to notice the
flexibility of the platform, the TDSS sensors can be changed as needed
depending on the use scenario requirements as long as they have wired
interfaces, or wireless (WiFi / Bluetooth).
Each of the FRSS tactical vests
with wearable sensors, carry a small computational module responsible for the
local system management, data gathering and the relay of this data towards the
C2. These are also responsible for the management of communications and data
security, among the FRs team members and from the team to the C2 while ensuring
that even in case of communication loss with the C2 the system continues
working and supporting the team executing the mission on the field.
3.3 Universal Tactical Display (UTD)
The UTD consists of a rugged, MIL[1]
grade, android tablet running a dedicated application that interfaces
wirelessly to the team leader computer. In it, the Team Leader can have a more
complete and accurate view of the mission to preform, its objectives and data
collected from the team, as at the same time it can give simple inputs so the C2
knows in real-time how the mission is rolling out.
Among others it is possible to
highlight some of its functions/features:
- Graphical display;
- Mil grade specification, enables its use in harsh environments;
- Mapping of the region where the mission occurs;
- Shows the position of each team member on the map;
- Shows the position of targets on the map (static/moving targets);
- Shows the type of target;
- Shows target threat level, making the team approach more secure;
- Shows data from sensors (mostly biometric data about FRs);
- Enables the team leader to recall the mission plan;
- Enables
the team leader to report to the C2 the status of execution of each mission
step
[1] MIL-STD-810 covers what different types of equipment should be able
to withstand given their use cases, and how the devices should be tested to
ensure compliance. Included are environmental effects such as drop, shock, fog,
humidity, sand, vibration, leakage, explosions, and more.
4. Integrations with other Tools
The following figure gives a
general overview of the architecture depicted for 7SHIELD implementation. On
the top right corner, the KR14 (TDSS) is part of the response and mitigation
tools, and works directly with the KR20 (ENGAGE) tool, which belongs to the
monitoring, early warning and situational picture tools.
In Figure 4‑2 a
more detailed interaction plan is laid out, focusing on the tools directly
involved in the TDSS operation.

Figure 4‑2 – TDSS integration overview
The TDSS is formed by two main
building blocks: (1) the wearable
equipment, embedded in the tactical vest and taken to the field operations by
the FRs, while (2) is the Base Station that establishes
the bridge between the TDSS and the 7Shield’s core components.
4.2 Data Exchange Mechanism
The TDSS is capable of operating in
stand-alone mode with a reduced set of functionalities, but to fully explore
the FRSS capabilities, it must be integrated in the 7SHIELD system as shown in Figure 4‑2. This
allows not only to share data acquired during field operations, but also to
receive vital data concerning the mission and targets evolution.
To achieve this the FRSS, communicates
with 7SHIELD’s Kafka broker, publishing and consuming specific topics that
carries this data back and forth. In the same way, the C2 by using a part of
the ENGAGE tool, handles the FRSS data and related functionalities.
The tool uses seven topics. Four
for data publishing and three for data consuming and with roles as follows:
SL.FRS.INFO (Sensor data information)
To inform the 7SHIELD system about
the sensor data information of the FRs team.
SL.FRS.MISEVIDENCE (Mission evidence
information)
To provide the 7SHIELD system with evidence
data captured by the FRs team, during a mission, for evidence and post crises
management (note: for future use).
SL.FRS.MISTATUS (Mission history with
present status)
To inform the 7SHIELD system about
the status of the FR mission, during post crises management. It sends a complete
history of the mission (steps already executed).
SL.FRS.MISSION (Complete mission description,
to be executed by the FRSS)
To transmit a new
mission from the C2 to the FRSS.
SL.FRS. SCELEMENTS (Scenery elements of
the situation)
To transmit to the FRSS system and
share with other C2 modules, context relevant information related to a
particular mission to be executed or in execution by FRSS (scenario elements,
e.g., waypoints, targets, threats).
SL.FRS.STATUS.RESP (Provides current
status of FRSS 7SHIELD component)
Provides current status of FRSS
7SHIELD component to the C2, can be sent in response to a status request or
periodically without a specific request from C2.
SL.FRS.STATUS (Component status
request)
Enables the C2 to request the current status of FRSS 7SHIELD
component.
4.3 Interaction with other Tools
To fully explore the TDSS capabilities, it must be
integrated with a C2 and interact with the KR20, ENGAGE tool, where mission can
be defined, targets and objects can be appointed and all data coming from the
FRs can be visualized by the operator and even stored for latter analysis. For
further details about ENGAGE tool, please consult the ENGAGE tool user manual [1]
5. Infrastructure Requirements
The Tactical Decision Support
System (TDSS) has the following requirements:
Room to receive the TDSS, base
station;
- Power outlet;
- Ethernet port, with access to
the C2 local network (with access to the Kafka Broker);
- Area to store the tactical
vests;
- An adequate space to place all
battery chargers for the equipment/wearables.
6. Operation Manual
This section
explains how the tool must be installed and configurated, how to make the
set-up of each component and the steps that should be considered when using the
tool.
6.1 Set-up
The FRSS provides a system for FRs
and C2 structure, to enhance field operations and mission coordination.
FR’s wearable equipment is
presented in a form of a vest (see Figure 6‑1) and
has two possible configurations:
- Team Leader vest – equipped with a computer unit, communications module, a heart rate
sensor, a body temperature sensor, a radio for voice communications, and a
power bank to supply energy to the components included in the computer unit.
Also, the UTD is accommodated in the vest.
- Team Member vest – equipped with a computer unit, a heart rate sensor, a body
temperature sensor, a radio for voice communications, and a power bank to
supply energy to the components.

Figure 6‑1 – FRSS wearable tactical vest
From the components point of view,
the FRSS is a set of equipment’s that is to be used by the team leader and members.
The components are detailed in the next figure:

Figure 6‑2 – FRSS tactical gear
The TDSS Base Station is also
deployed in the 7Shield core system to perform as gateway in the connection of
the FRSS with the 7Shield core system. For an easier deployment, the terminal
is set in a 19” crate for mobile operations. It is fully contained, and all
required equipment is stored inside. This gateway is easily deployed in less
than 30 minutes.
Sub-section 6.2 presents
the details and set-up of each component: Team leader, Team member, UTD and
Base Station.
Configurations
The environment must be configured
to accommodate the tool and to be possible to have communication in the local
network. The IP of the Kafka
broker, port, and other access credentials must be provided, as presented in
the next examples.
Two configuration files are needed:
- configFile.properties for the UTD – by default, it is connected to the IP presented next.
To change it, it can be possible through app Explorer+ and in the location: 7storage/emulated/0/Android/data/com.example.a7shieldscreenInov/files/MyFileStorage


The team leader carries the most
complete of the FRSS wearable vests and as already mentioned all data flows
through the Team leader FRSS equipment. This vest equipment’s create the local
LAN network where all the team members vests connect, and also stablished the
long-range connection with the C2. On the team, the Team leader has a role more
of coordination of the team on the field and is the one with direct connection
with the C2.
To perform its mission, the team
leader has an UTD at his disposal where he receives enhanced information about
the mission, and with it, the team leader has a better view of the available data
about the mission and all the data being collected from the sensors carried on
all team vests.
6.2 Getting Started
6.2.1 FRSS
6.2.1.1 Team Lead
Before wearing a Team Leader vest,
its necessary to complete several steps to properly install all its components
and activate the vest. The following diagram gives an overview of the sequence
of steps to undertake in order to prepare the vest.

Figure 6‑3 – Team Leader vest setup
1. First take the computer unit
and connect the power banks (USB type A to bottom power bank and USB-C to top
power bank);
2.
Press in sequence the top power
bank ON button and then the computer power button;
3.
Attach the magnetic GPS antenna
to the left shoulder magnetic area and attach the USB-A connector to the
computer;
4.
Store the computer unit in the
back pouch and close the zipper;
5.
Now turn the vest and on the
front hang the Radio;
6.
Store the UTD (see sub-section
3.1.3) in one of the vest front pouches;
Before wearing a Team Member vest,
its necessary to complete several steps to properly install all its components
and activate the vest. The following diagram gives an overview of the sequence
of steps to undertake in order to prepare the vest.

Figure 6‑4 – Team Member vest setup
1.
First start by fixing the
computer unit to the back of the vest using the velcro patch;
2.
Attach the magnet GPS antenna
to the left shoulder magnetic area;
3.
Proceed with powering the
device, by connecting the USB type A to the power bank;
4.
Store the power bank on the
back pouch and close the zipper to the left of the pouch;
5.
Now turn the vest and on the
front hang the Radio;
6.2.2. TDSS Base Station
In order to have the TDSS Base
Station ready to operate, several installation steps must be performed. The
following diagram gives an overview of the sequence of steps to undertake in
order to prepare the Base Station.

Figure 6‑5 – Preparing the TDSS Base
Station
1.
Once the base station location
has been stablished, start by removing the front and back lid of the portable
crate;
2.
Attach the power cable and
local LAN cable from the host system (7Shield core local network);
3.
Connect the long-range antennas
to the radio;
4.
Connect the smallest local
Wi-Fi antenna to the radio;
5.
If the long-range antennas are
to be placed near the base station, then magnetically attach them to the crate
itself;
6.
Once the antennas are in place,
press the power button.
7.
The Base Station is ready.
6.3 Nominal operations
In the presence of an event, a mission
must be created previously. The ENGAGE tool serves this purpose. The mission is
created with multiple steps, defined targets/objects, and assigned to a team
composed by a Team Leader and up to four Team Members. The mission is sent to
the team already in the field so it can be executed.
FRs’ Team equips the vests with all
the required devices and sensors (see Figure 6‑6). On
the field, the Team Leader interacts with the UTD to start the Mission and to
see the mission’s map, live sensor data gathered by the team and consult the
assigned mission with steps and targets.
Figure 6‑6 – Team equipped with vests
(sensors and devices)
The main purpose of the FRSS is to
support FRs in the execution of their assigned mission, by delivering enhanced
information about it and the Team Members to the Team Leader and C2 (i.e.,
mission steps, team members positions, exterior temperature and CO2
concentration, heart rate, body temperature, and classification of targets).
During the execution of the
assigned mission, as the Team moves across the map, real time sensor data is
updated on the UTD (see Figure 6‑7) along
with the Members’ positions on the Action Dashboard (see section 7 for
detailed information about the UTD dashboards).
Alongside, Mission Dashboard is
also updated as the Mission progress (see Figure 6‑8).
Figure 6‑8 – Mission dashboard
After executing all steps, the
Mission is concluded and finishes.
7. User Interface
The Universal Tactical Display
(UTD) is used by the Team Leader to have a more complete and accurate view of
the mission to perform, its objectives and data collected from the Team, as at
the same time it can give simple inputs so the Command Centre knows in
real-time how the mission is rolling out.
UTD Access
To access the UTD, Team Leader must
execute the following steps:
1.
Initialize the android system
and unlock the device by typing the provided FRSS Team Leader UTD password;
2.
Locate and run the FRSS app;
3.
The UTD is ready to use.
New Mission
After
entering UTD, a new mission screen appears, as presented in Figure 7‑1
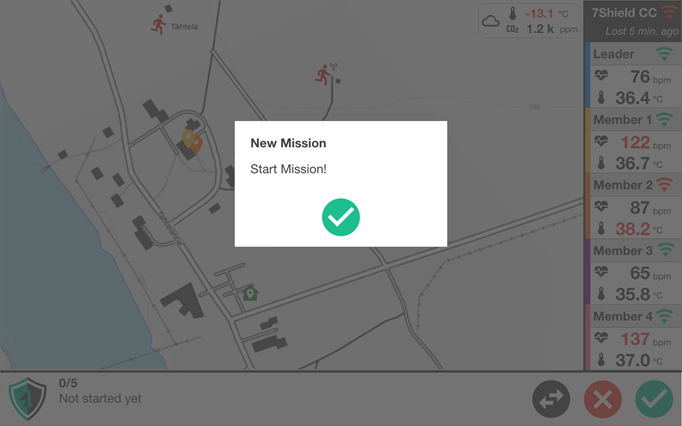
Figure 7‑1 – New mission
1.
To start the new mission press the
green Ok icon;
2.
The Action dashboard appears
(see following section).
UTD general overview
Once ready for operation, the UTD
provides two dashboards to the Team Leader:
1.
The Action dashboard:
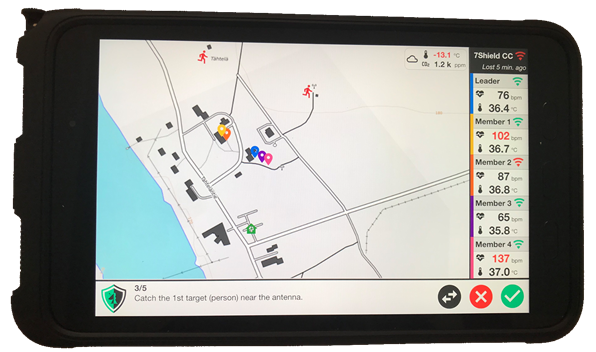
Figure 7‑2 – Action dashboard
1.
The Mission dashboard:
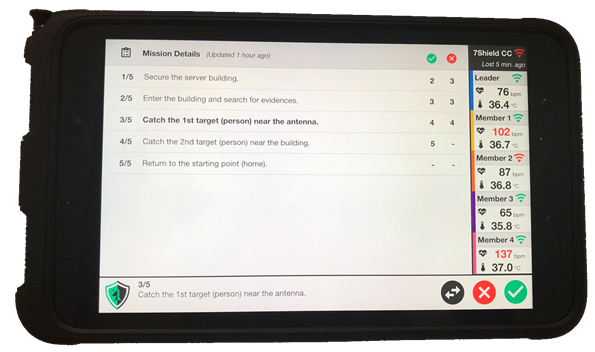
Figure 7‑3 – Mission dashboard
The active area of the UTD screen
for operating is reduced to the bottom right of the screen, where the user
finds a minimalistic input interface with just three visible buttons, which can
change their function based on user interaction.
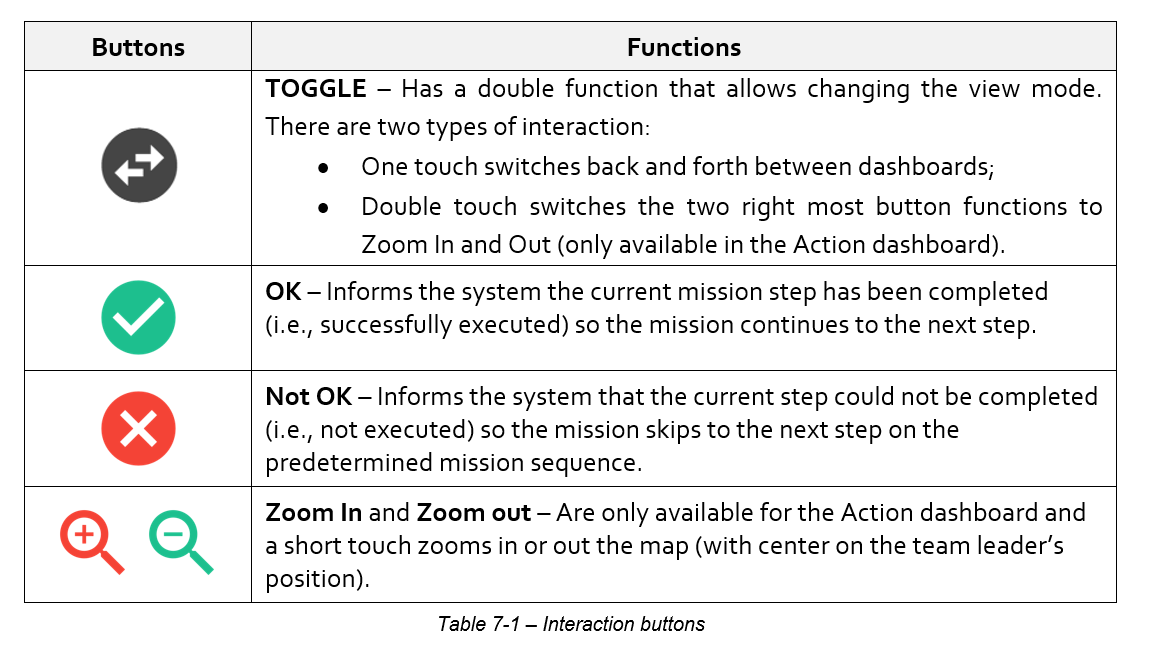
There are 5 different button types,
one of them having a dual function, depending on if it is pressed once or two
consecutive times as expressed by Table 7‑1.
Action Dashboard Interaction
In the Action Dashboard the
real-time data about the mission and sensors are displayed as the following image
(see Figure 7‑4).
This screen provides a set of interactive features for the visualization of
mission operations coupled with automated coordination and monitoring
activities, increasing situational awareness, and proving analytical
information to support the individual’s thinking process, i.e., the Team
Leader, as well as in promoting impactful decisions and reduce risks.
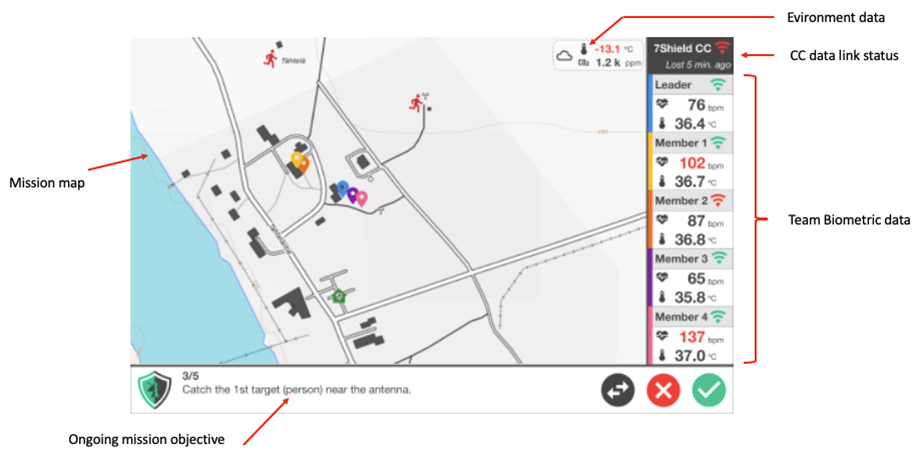
Figure 7‑4 – Action dashboard
elements
The majority of the screen is
filled with a map of the area where the mission is taking place, with overlaid
information regarding:
Team Members and Leader
positions (presented as a location pin);
- Mission data, like
targets/threats (presented with different icons according to the type);
- Sensor information regarding
exterior environment (overlaid in the right top of the map).
- Sensor information regarding
exterior environment consist of the following:
- Temperature;
- CO2 level.
In the right column of the screen,
the sensors’ data from all the team can be seen. Each Team Member and Leader
carry the subsequent monitoring sensors (see Figure 7‑5):
- Heart rate (in bpm);
- Body temperature (in Celsius
degrees);
- GPS.
This information is sent to the
Team Leader's equipment, which can then see this data and quickly understand
the status and location of each one. To facilitate the location of the member
on the map, the colour of the location pin and the vertical bar where the data
is located hold the same colour:
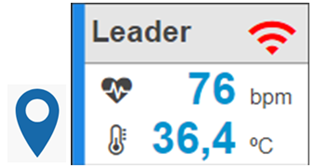
Figure 7‑5 – Team member location pin
and measurements
Some of the values that are
constantly changing (e.g., temperature, heart rate) are highlighted when
“safety” thresholds are passed below a minimum or above a maximum. The values
change to red. The following “safety” thresholds were defined to the sensor’s
parameters values that are visible in the GUI:
- Body temperature: 35-38 º
Celsius (variation margin of 0.3);
- Heart rate: 50-150 bpm
(variation margin of 5);
- Exterior Temperature: 2 – 26 º
Celsius (variation margin of 0.3);
- Exterior CO2: 500-1400 ppm
(variation margin of 100).
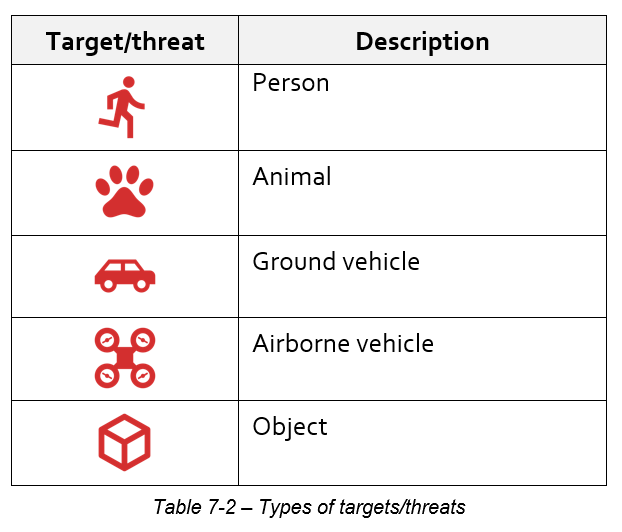
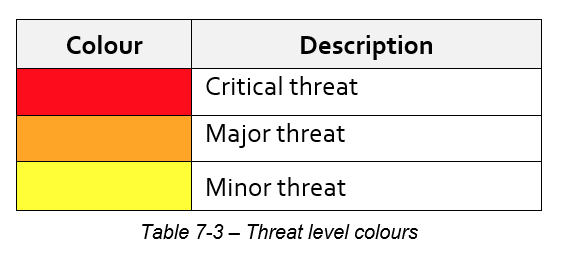
Mission data like targets or
threats, can be shown in the map being static or moving, and can disappear
during the execution of the mission. The type of targets/threats icons that can
appear is shown in Table 7‑2 and
can change its colour accordingly to their severity level (see Table 7‑3).
Team Leader is also informed about
if there is communication, both with the outside (communication with the
external network, i.e., Command Centre) and with each Team Member. This
indication is made by the colour of the symbol:
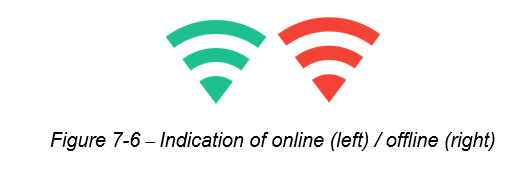
Where:
- Green colour indicates that there is communication;
- Red colour indicates that there is no communication.
In case there is no communication
with the outside, an information is also displayed and indicated on, how long
has it passed without a connection with the external network.
On the bottom of the screen appears
the currently mission step to be pursued, according to the steps of the mission
that can be seen in the Mission dashboard. The interaction between the Team
Leader and the UTD can be done in the bottom of screen accordingly to the
buttons explained in Table 1.
Mission Dashboard Interaction
The Mission
Dashboard (see Figure 7‑7) displays a detailed overview of all the
mission objectives, with a previous defined sequence, which was defined and
uploaded to the UTD by the Command Centre.
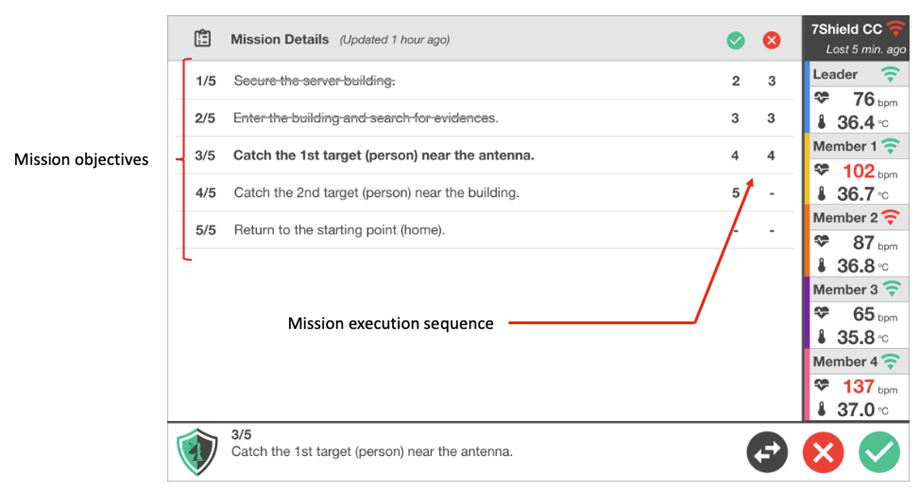
Figure 7‑7 –
Mission dashboard elements
The majority of the screen presents
the mission steps and its flow accordingly to the success or not of a step. In its the left most column it is displayed the
mission objective index number of step, each followed by its description. The
right most column, indicates the next step on the sequence, depending on the OK
or Not OK result of the current step.
For example,
in step 1 “Secure the server building”, if the Team Leader marks this step as
successful executed, i.e., “OK”, then the next step will be step number 2
“Enter the building and search for evidences”. Otherwise with a “Not OK” the
mission execution jumps to the step 3 “Catch the 1st target (person) near the
antenna”.
In the list of mission steps, the
step with the bold text is the current running step. Whenever a step is
executed, it is crossed out, indicating that it has already been
executed.
The rest of
the elements on this dashboard act in a similar way to the Action Dashboard.
The right most column shows team’s sensors data and the bottom bar shows the
current mission step under execution.