ResilBlockly is a Model-Driven Engineering (MDE) tool that evolves Blockly4SoS , and which evolution has been devised in the context of 7SHIELD in order to support the modelling of the main cyber-physical systems concepts, but also to perform hazard analysis, to enable threats modelling, and to perform the analysis of cascading effects.
ResilBlockly allows the user to extend cyber-physical ordinary Systems of Systems (SoS) models with cybersecurity information, including critical assets and associated vulnerabilities, weaknesses and analysis of the cascading effects of complex risks.
Moreover, the tool enables to graphically represent attack paths and, thanks to the integration with a simulation engine, to represent interactions between system components both under normal conditions and during attacks.
2. Main purpose and benefits
MDE
techniques can now be a very useful guide for designing ICT and IACS systems
that are critical for safety and security. However, the current MDE
methodologies and tools are unable to keep pace with the evolution of
technologies and the increasingly growing cyber threats.
Critical
infrastructure models must in fact nowadays consider the cybersecurity issues
related to safety and modelling languages currently used in the design
phase, but actually they do not support the integration of cyber threats and
related mitigations. Nor do these tools provide sufficient support to guide the
critical risk assessment phase during design, but also for the maintenance of
such systems.
In
order to break down these limits, the ResilBlockly modelling tool extends the
Blockly4SoS tool, to support risk assessment and cyber threat
analysis through the integration of features such as HAZOP, cascading effects analysis,
threat analysis, integration of the CWE and CAPEC Catalogue for the identification of the
system weaknesses, integration of the CVE catalogue for the identification of the
vulnerabilities.
Supporting
the analyst activities during the system threat analysis is one of the goals
for ResilBlockly which can provide a number of benefits in designing
safety-critical systems. Indeed, discovering cyber threats in the design phase
can help to achieve the correct design of the security systems avoiding the
need for further architectural changes after system implementation.
Furthermore,
given the increasing number of cyber threats and their continuous evolution,
these systems continually need to be updated to face the new threats.
ResilBlockly functionalities, such as the Threat Analysis and the Cascading
Effects Analysis, support also maintenance and updating of security systems at
every stage of the project, providing awareness of the impact of new threats on
the system and facilitating the identification of mitigations.
The main functionalities
designed and developed in ResilBlockly are the following:
- Definition
of a Profile, through the Profile
Designer which permits to design a profile for specific domains;
- Instantiating
of a Model, through the Model Designer
which allows to create a model that adheres to its profile and specific domain;
- Risk Assessment
functionality including:
Functional Analysis, Interface Analysis, Cascading Effects Analysis;
- Threat
Analysis, that is the association
of weaknesses and vulnerabilities to the assets (with the CAPEC catalog support
for weaknesses identification).
Two
fundamental concepts, which identify the two main features of ResilBlockly are:
- Profile,
that is an abstraction of components and relationships for a specific domain;
- Model,
that is an instance of the profile.
Below
is reported a brief description of ResilBlockly features, while main functions relevant for 7SHIELD project are
described in detail in the User Manual.
The
Profile Designer functionality allows the expert user to specify classes and
relations for modelling SoS in specific domains. By using the Profile Designer,
an ad-hoc profile specific to the domain can be created from scratch and shared
with other users.
On
the other hand, the Model Designer can be used for creating models that
represent instances of their corresponding profile. ResilBlockly models
describe components, relationships, communications, but also security
properties of the systems including weaknesses and vulnerabilities that can be
used for executing different types of security analyses.
The
Risk Assessment functionalities have been implemented for supporting the
security analyses using security information taken from the model (e.g.,
vulnerabilities, weaknesses). ResilBlockly Risk Assessment functionalities include:
Functional Analysis, Interface Analysis, Threat Analysis and Cascading Effects
Analysis.
In particular Threat
Analysis involves the weaknesses and vulnerabilities identification based on
searching function in public
catalogues (i.e., CWE, CVE, CAPEC). In particular CAPEC integration helps to examine
attack paths for determining the impact on the system and possible mitigations.
Determining the impact means to evaluate the severity
of the impact. Retrieving severity
is the main step to risk determination in ResilBlockly, that evaluates risks
related to threat combining the severity value with the threat likelihood
value. ResilBlockly does not provide any automatic likelihood estimation, but
allows the user to determine this value after having reviewed the information
possibly available in the catalogue. Finally, the Risk is automatically
computed by ResilBlockly.
The Cascading Effects
Analysis, with modelling dependencies, has been designed and developed
extending ResilBlockly for the 7SHIELD purposes. This functionality allows the
analyst to examine the propagation of failures in the system components
starting from the model information. The functionality provides graphical
representations of the failure propagation paths showing the cumulative risk
evaluated for each path.
Figure 4‑2: Interactions of
the MBDA with the other tools
The MBDA publishes on Kafka Broker
also Weaknesses and Vulnerabilities associated with the assets of the pilot
site and the analysis of cascading effects. This integration will be completed
in the next months and tested in the last demos. The information about
weaknesses and cascading effects will be integrated in the situational picture
through the SPGU and shown in the CPTMD.
Moreover, the User Interface of the
MBDA is included through iFrame in the CPTMD to allow the user to use the MBDA
in a window of the main dashboard.
5. Infrastructure Requirements
Being
tool available online, ResilBlockly requires an internet connection and a web
browser installed.
ResilBlockly
does not require particular performance.
6. Operation Manual
ResilBlockly can be accessed
through the web browser and the authentication is performed by the
Single-Sign-On (SSO) through the web page in Figure 6‑1.
Figure 6‑1 – MBDS Log in
via SSO
6.3 Getting started
The first step required to the user is the
selection of which components, between Profile Designer and Model
Designer, has to be used. Hence the starting ResilBlockly page, shown in Figure 6‑2,
requires the selection is performed simply by clicking one of the two icons
(i.e., Profile Designer or Model Designer).
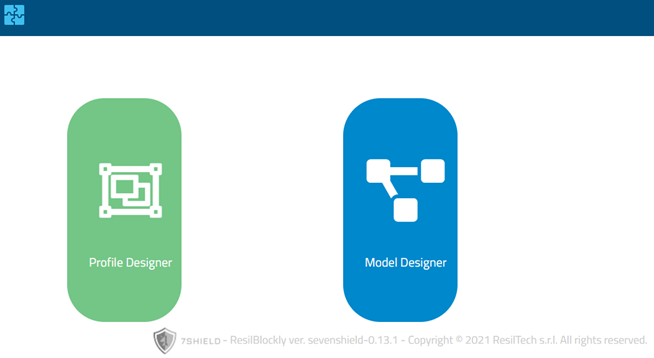
Figure
6‑2 – ResilBlockly Access page
In case of the Model Designer is
selected, the user can select an existing profile or open an existing model by clicking
on the Open Model button (folder icon) located on the horizontal
menu bar, depicted in Figure 6‑3. Otherwise,
he can use the Profile Designer to create a new profile.
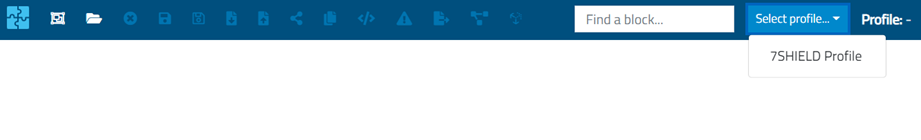
Figure 6‑3 Selection of the Profile from Model Designer
Just
after having clicked on the Open Model button, the list of workspaces and related models available are
displayed in a table shown in Figure 6‑4, and information of each
workspace is characterized by the name of the model, the related profile, the
owner of the model, the user who has locked the model, and the timestamp of the
last save.
Figure
6‑4 Open workspace in Model Designer
Alternatively, if the user wants to
import an existing model, he can use the import model function accessible from
the menu at the top right of the Model Designer, as depicted in Figure 6‑5. The
same operation is possible for importing profiles through the Profile
Designer.
The
Profile Designer provides the creation of a new
profile or the modification of an existing profile. The Profile Designer includes: the definition of the
classes to which the system components belong, the specification of the
preliminary weaknesses in the system, vulnerabilities and dependencies.
In
the Model
Designer, the
system can be modelled, weaknesses and vulnerabilities can be specified and the
function of Analysis of Risk of Cascading Effects can be executed.
The
Profile Designer is only used by experts while
the Model
Designer is used
by users and pilot users.
In
order to define and design ad-hoc profiles for a specific domain, the expert
has to reach the ResilBlockly web address and then, after logging in with the
assigned credentials, click on the Profile Designer (the GUI for the choice between Profile and Model Designer, is
depicted in Figure 6‑2).
Figure
6‑5
– Key elements available in ResilBlockly Profile Designer
Figure 6‑5 shows the initial page of the Profile Designer, where the key elements
composing it are:
- on the top right, a menu that once clicked
shows up the buttons for importing other profiles or for exporting the currently
opened one;
- a Block palette, from which the user can
select, drag and drop in the white area different type of blocks that are going
to constitute the profile;
- lenses (bottom right) and Block Search (top
centre) for facilitating the visualization and search in case a profile becomes
of high dimensions. These elements are available also in the Model Designer;
- a Toolbar with several functionalities, also
available in the Model
Designer as
well, but with some different tools;
- the button with the username, for the
logging out.
To
add a Class Block in a Profile Designer workspace (the white area) is necessary to drag and drop it from the
block palette. To delete a block, instead, the user can either i) right click
on the block and select the item Delete Block (as shown in Figure 6‑6), or ii) left click on the block
and press the Backspace or Delete keys of the keyboard.
Figure
6‑6 Operations available on block
added to the model
Other
features are available by right clicking on the white workspace area, i.e.,
Undo or Redo (equivalent to Ctrl+Z and Ctrl+Y respectively), Clean Up Blocks,
that aligns all the blocks vertically in a single column, or Delete Blocks.
The
key elements in ResilBlockly Profile Designer, available in the Block palette shown in Figure 6‑5, are: Class, Attribute,
Relation, Menu and Menu Item.
In
a Relation Block, the user should indicate the Target Class Name, that is the name of the class with which
the relation exists. With a Relation Block it is possible to model different type
of relations (currently the choice has to be between Reference, the default
type, and Composition).
Finally,
the multiplicity of the relationships is managed with cardinality in Relation Block
(by default, both the lower and upper cardinality is 1, but the upper can be
set to n as well). An examples of Class Blocks and their inheritance,
containing Relation Blocks and their cardinalities, is given in Figure 6‑7; the example shows RUI and RUMI
classes, and is taken from the AMADEOS SoS Profile.
Figure
6‑7 Example
of Class and Relation Blocks usage with inheritance and different cardinalities
Attribute
blocks can be used for specifying characteristics of a Class that can be
expressed with a simple string or number (e.g., an ID, as shown in Figure 6‑8).
Figure
6‑8 Attribute block with currently available Types
Finally,
the Menu and Menu item blocks are elements that do not really constitute the
profile itself, but are rather useful for organizing the Classes (one for each
Menu item) in viewpoints (one for each Menu), as shown in Figure 6‑9; these viewpoints will be then
shown in the Model
Designer when
the profile will be selected.
Figure
6‑9 The Communication Menu corresponding to the
respective Viewpoint of AMADEOS SoS Profile
The 7SHILED profile has been
created with 3 classes of concepts:
1.
System-of-Systems (SoS) concept,
according to the AMADEOS Profile [1][2]
2.
Security view point concepts,
in particular concepts about weaknesses, vulnerabilities mitigations and
threats
3.
Asset taxonomy concepts, based
on categories.
From
Profile Designer, at any time (e.g., after having
completed the design of a new profile) it is possible to switch to Model Designer by pressing on the first button
on the top left (Figure 6‑10). As an alternative, it is
possible to reach the same functionality by clicking on Model Designer directly after the log in.
Figure
6‑10 ResilBlockly Model Designer Homepage
Figure 6‑10 shows the initial page of Model Designer, where in the “Find a Block“ white search area, the user can
type the name of a Block existing in the workspace in order to localize it (it
will be displayed with yellow edges).
The
Profile Designer opens the Profile Designer in a new tab while the Open model
feature opens an existing and previously saved model.
To
add a block in the Model Designer workspace (the white area) it is necessary to drag and drop it from
the block palette.
The
model blocks can be connected together as if they were puzzle pieces, but the
connections are only permissible if they are consistent with the relationships
defined in the profile. For example, with regard to the AMADEOS profile, a RUMI
can only be connected to a block using the relationship "Has_a_rui".
In
Figure 6‑11 two workstation blocks have been
added to a new model, then the two blocks have been connected using RUMIs with
which the workstations can communicate. Blocks, as RUMIs, can attached to other
blocks inserting them in the appropriate slots or using the plus keys to
generate a new one inside the block itself.
In
this example the two RUMIs represent the communication interfaces between of
the workstations that exchange messages (Message 1 and Message 2). The RUMI “Station_1 – Station_2” is linked to the RUMI “Station_2 – Station_1” with the reference “Station_2 – Station_1” (green block). On the other hand, the RUMI “Station_2 – Station_1” is linked to the RUMI” Station_1 – Station_2” with the reference “Station_1 – Station_2”.
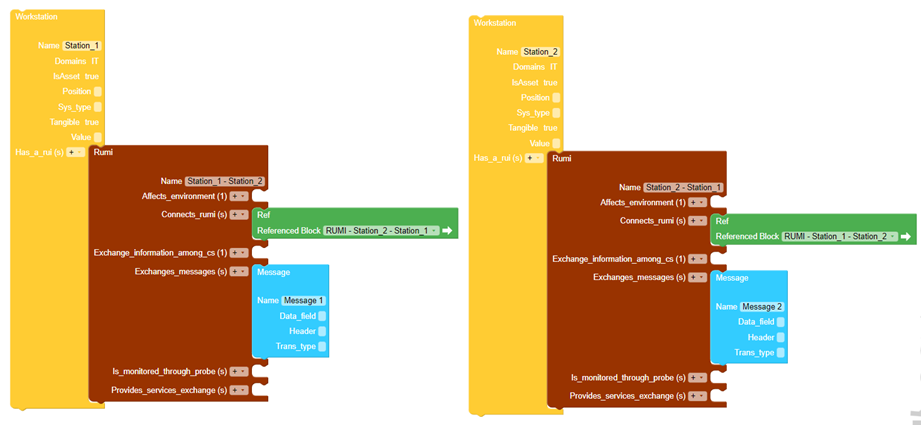 Figure 6‑11 Adding a
block in ResilBlockly Model
Figure 6‑11 Adding a
block in ResilBlockly ModelProceeding
with this technique, the models can contain various types of components
interconnected through RUMIs or through RUPIs, according to what the modeller
wants to represent.
6. 4.3 Interface Analysis
In
ResilBlockly, the Functional and Interface Analysis is based on
the HAZard and OPerability Study (HAZOP).
As illustrated
in Figure 6‑12, the Functional Analysis tab of the Risk
Assessment has two additional inner tabs called Keyword templates
and Functional analysis respectively.
The Keyword
templates inner tab allows the user to specify the analysis template and
the keywords required by the HAZOP methodology. It has, on the left, a text
area for the analysis templates specification. There, the users can build the Keywords
template, appropriately filling the three place holders by pressing the
clickable blue texts with the following names:
- Add
[block];
- Add[function-description];
- Add[keyword].
Then, in the
Keywords field on the right side of the interface, also the keyword should be
added; at this stage, by clicking on the button with the + symbol, the template
is completely specified and added to the model.
Thanks to the
specified template and to the added keyword, the [block] and the
[function-description] placeholders will be automatically replaced respectively
with the name of the Class Blocks and of the corresponding function. The
[keyword] placeholder is instead replaced with the keyword just added.
Figure
6‑12
Keywords and Templates used for the Functional Analysis
Hence,
clicking on the Functional Analysis tab (the second inner tab), the
functional analysis is automatically applied to all the identified function
types instantiated in the model.
Figure 6‑13 shows a portion of the resulting a Functional
Analysis in a table. The first five columns: Analysis ID, Block, Function
description, Keyword, High level description of the scenario to be analysed,
are automatically filled, without any further user intervention.
On the top right (as shown in Figure
6‑13), the
green button called CSV export allows the user to download a report of
the functional analysis in csv format. This report is a pre-filled document
while the HAZOP analysis can be completed offline by filling the fields. This
last step is the unique not assisted by ResilBlockly.
The Interface
Analysis is performed in a similar manner, compiling the template with the
messages exchanged through the interfaces (the RUMIs), specifying an ad-hoc set
of keywords.
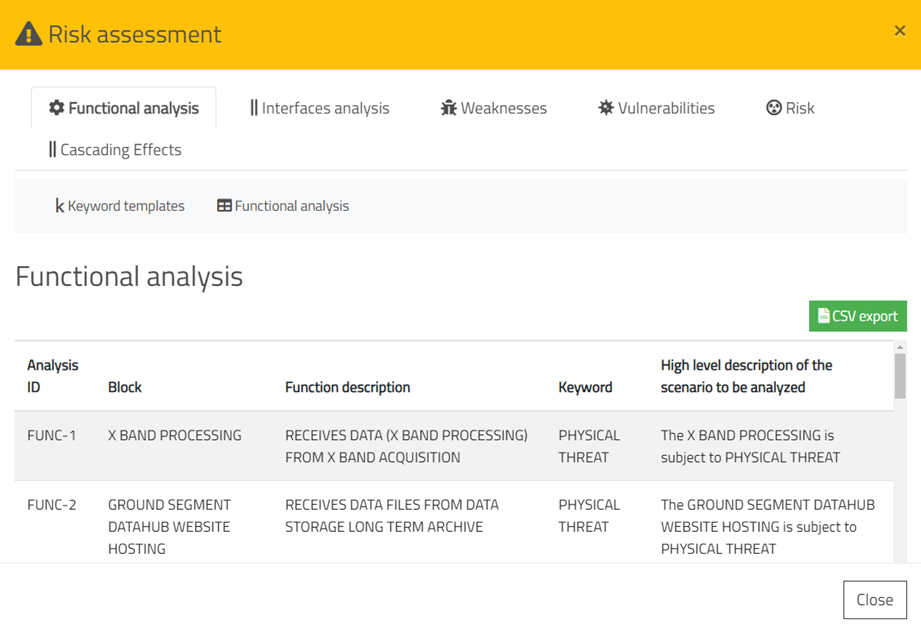 Figure 6‑13 portion of the Functional Analysis
The threat analysis foresees as first step the Identification of the threats. This step is assisted by ResilBlockly, which allows the analyst to associate threats from MITRE open catalogues (i.e., weaknesses from CWE [6] and vulnerabilities from CVE [7]).
The threat identification builds on the assumption that the technical documentation about the system and its components has been retrieved and extensively studied.
Then, the steps that can be followed both for the identification of weaknesses and vulnerabilities are: identification by similarities, keywords extraction for catalogues search, CWE search, CVE search, CWE from CAPEC, CVE from CWE, CWE from CVE (through “observed examples”), CWE from CVE (through NVD). This process typically produces a really wide list of threats, that can also be appropriately integrated with custom weaknesses and vulnerabilities eventually retrieved from different sources.
Therefore, the choice of good keywords is fundamental, and the results have to be filtered.
6.4.5 Association of Weaknesses
After having
modelled a system, the identification of threats can be initiated in the Model Designer
by clicking on the Risk Assessment icon and then choosing the Weaknesses
tab.
Figure 6‑14 shows the Weaknesses tab of the Risk
Assessment, that allows to choose a Class Block and to associate weaknesses
to it. The Class Block can be selected through the Block field on the
left of the interface, and only after selecting a specific block it is possible
to associate weaknesses with it.
Figure
6‑14 Weaknesses tab in Risk Assessment
Weaknesses can
be identified by keywords using the function Add Weakness, accessible through
the Add weaknesses button (Figure 6‑14) in the Weaknesses tab. After clicked
the Add weaknesses button a new interface with a CWE search field will
open (Figure 6‑15).
In this field,
the user can specify keywords that ResilBlockly uses for searching related
weaknesses in the CWE catalogue. Hence, by clicking on the search button,
displayed as a magnifying glass, the tool performs the search and reports the matched
weaknesses in a table as shown in Figure 6‑15. Hence, the weaknesses can be associated with
the model block via the plus key.
Alternatively,
weaknesses can be identified exploiting the CAPEC catalogue searching by
keywords.
Figure 6‑15 Add Weakness
functionality
By click on
the button Show weaknesses report in the Weaknesses tab,
ResilBlockly shows the result of the weaknesses identification in a table (Figure 6‑16). This table includes all weaknesses added to
the assets in the model.
Figure
6‑16 An
example of Weaknesses Report available in the Risk Assessment
This report
can also be exported in CSV format. In addition, ResilBlockly also allows to
operate on the displayed report by excluding or re-including some weaknesses
inherited from the profile: in the case of an exclusion, a reason can be
provided. Weaknesses inherited from the profile are marked as Predefined, while
the ones added in the model are not. Excluded weaknesses and reasons will be
included in the exported report as well.
Weaknesses
associated to the model, thus not predefined, cannot be excluded, but they can
be directly deleted by clicking on the corresponding entry in the list of
weaknesses and selecting the blue bin icon on the left.
6.4.6 Association of Vulnerabilities
As for the vulnerability
identification, the user can click on the Risk Assessment and select the
Vulnerabilities tab for performing the association of vulnerabilities
from CVE catalogue.
This step is
analogous to the association of the weaknesses. Figure 6‑17 shows the graphical interface of the Vulnerabilities
tab.
Similar to the
weaknesses, vulnerabilities can be identified searching in the CVE catalogue by
keywords.
Figure
6‑17
Vulnerabilities tab in Risk
Assessment
The search and
association of the vulnerabilities is started by pressing the Add
Vulnerabilities button on the right of the Vulnerabilities tab as depicted
in Figure 6‑17.
The Show
vulnerabilities report button displays all the vulnerabilities
associated to the assets in the model in the tab and, as for the weaknesses,
allows to exclude vulnerabilities eventually inherited from the profile.
6.5 Cascading Effects Analysis
Cascading Effects
Analysis functionality is
accessible from the ResilBlockly Risk Assessment. However, the preliminary
first step foreseen by the functionality is the definition of the dependencies
between the assets through the Risk Designer in the Profile Designer,
shown in Figure 6‑18. Generally, the dependencies between the
components are defined through RUMI or RUPI interactions.
To define a
dependency, the user should specify in the Risk Designer: the Initiating
block, the Destination block, the Dependency between the two
blocks (e.g., exchange_messages, transports_thing), the Dependency Type (e.g.,
Communication, Service, Resources). The forms on the top of the Dependencies
tab (Figure 6‑18) can be filled using the drop-down menus
containing all blocks and all relationships defined in the profile.
Figure 6‑18 –
Dependencies definition for Cascading Effects Analysis
ResilBlockly
automatically retrieves from the model all the dependencies that have been
defined in the profile and displays them in a table within the Asset
dependencies tab of the Risk Assessment (Figure 6‑19).
Each
dependency is given by the triad <Initiating asset, Cascading asset,
Dependency object> which represents the dependence of the cascading
asset respect to the initiating asset in which the failure initially occurs.
The relationship between the two assets is called the Dependency Object.
In the Asset
dependencies tab (Figure 6‑19), Likelihood and Impact fields
are positioned next to each dependency. These fields should be filled by the
user.
After
evaluating Likelihood and Impact, the tool automatically
calculates the Dependency risk for each dependency. The risk level is displayed
in different colors from yellow to red depending on the level (e.g., High =
red, Low = yellow). If the analyst deems it appropriate, a dependency can also
be excluded from the analysis by clicking on the "trash" icon.
Once the
dependencies analysis is completed, the user can select threats to be analysed
through the Threat Analysis functionality (Figure 6‑20)
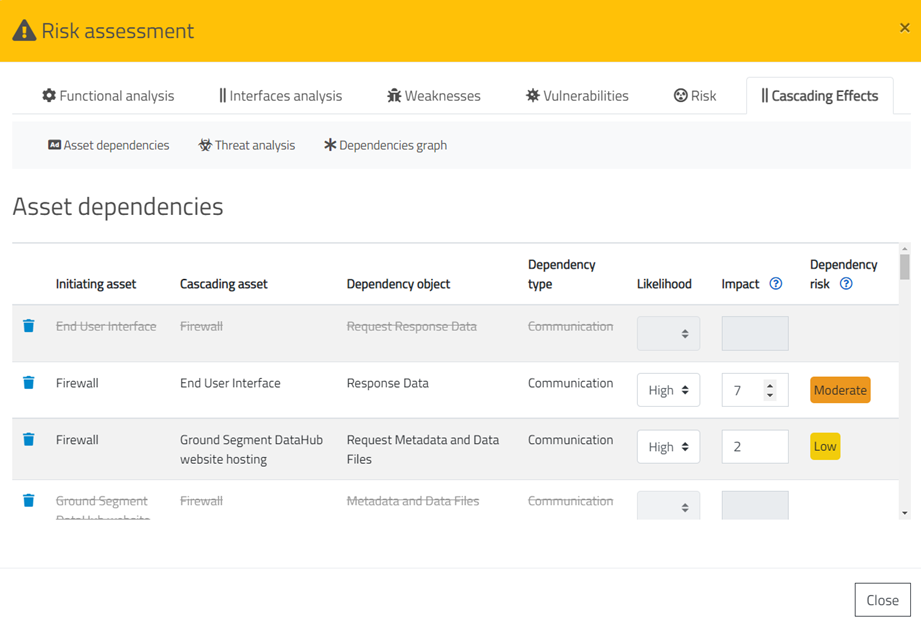
Figure 6‑19
Dependencies between assets for the Cascading
Effects Analysis
In this phase,
the assets involved (i.e., Impacted assets) and the related Likelihood
are assigned to the identified threats, belonging to the 7SHIELD threat
taxonomy.
Figure 6‑20 –Threat Analysis, selction of Threats
Once all
assets have been associated to the threats, the analysis ends.
ResilBlockly
allows the user to view the result of the Cascading Effects Analysis
through a graphical representation. Selecting an initiating threat and clicking
on the Open Dependency Graph button in Figure 6‑21, ResilBlockly shows the complete dependency
graph, as shown in the example in Figure 6‑22.
Figure 6‑21 Dependency Graph functionality
The asset
impacted by the initiating threat is highlighted by the symbol of the thunder
and in this example this asset is the Firewall. Edges represents dependencies
among the assets with which failures can propagate. In addition, each failure
propagation path is listed in the table (Figure 6‑21). Clicking on the related links all possible
propagation paths can be viewed in Figure 6‑23 with the relative Cumulative Risk.
Figure 6‑22 – Example of Dependencies Graph
Figure 6‑23 – Dependencies Graph for a specific path
with Cumulative risk